
Bring Your Own Data (BYOD)
Written by Cathy Ludwig. Should take about 4 minutes to read.
Intro
Last week, we attended the 2022 IBL User Group Meeting (UGM) in Varna, Bulgaria. It was a wonderful time (THANKS IBL)!
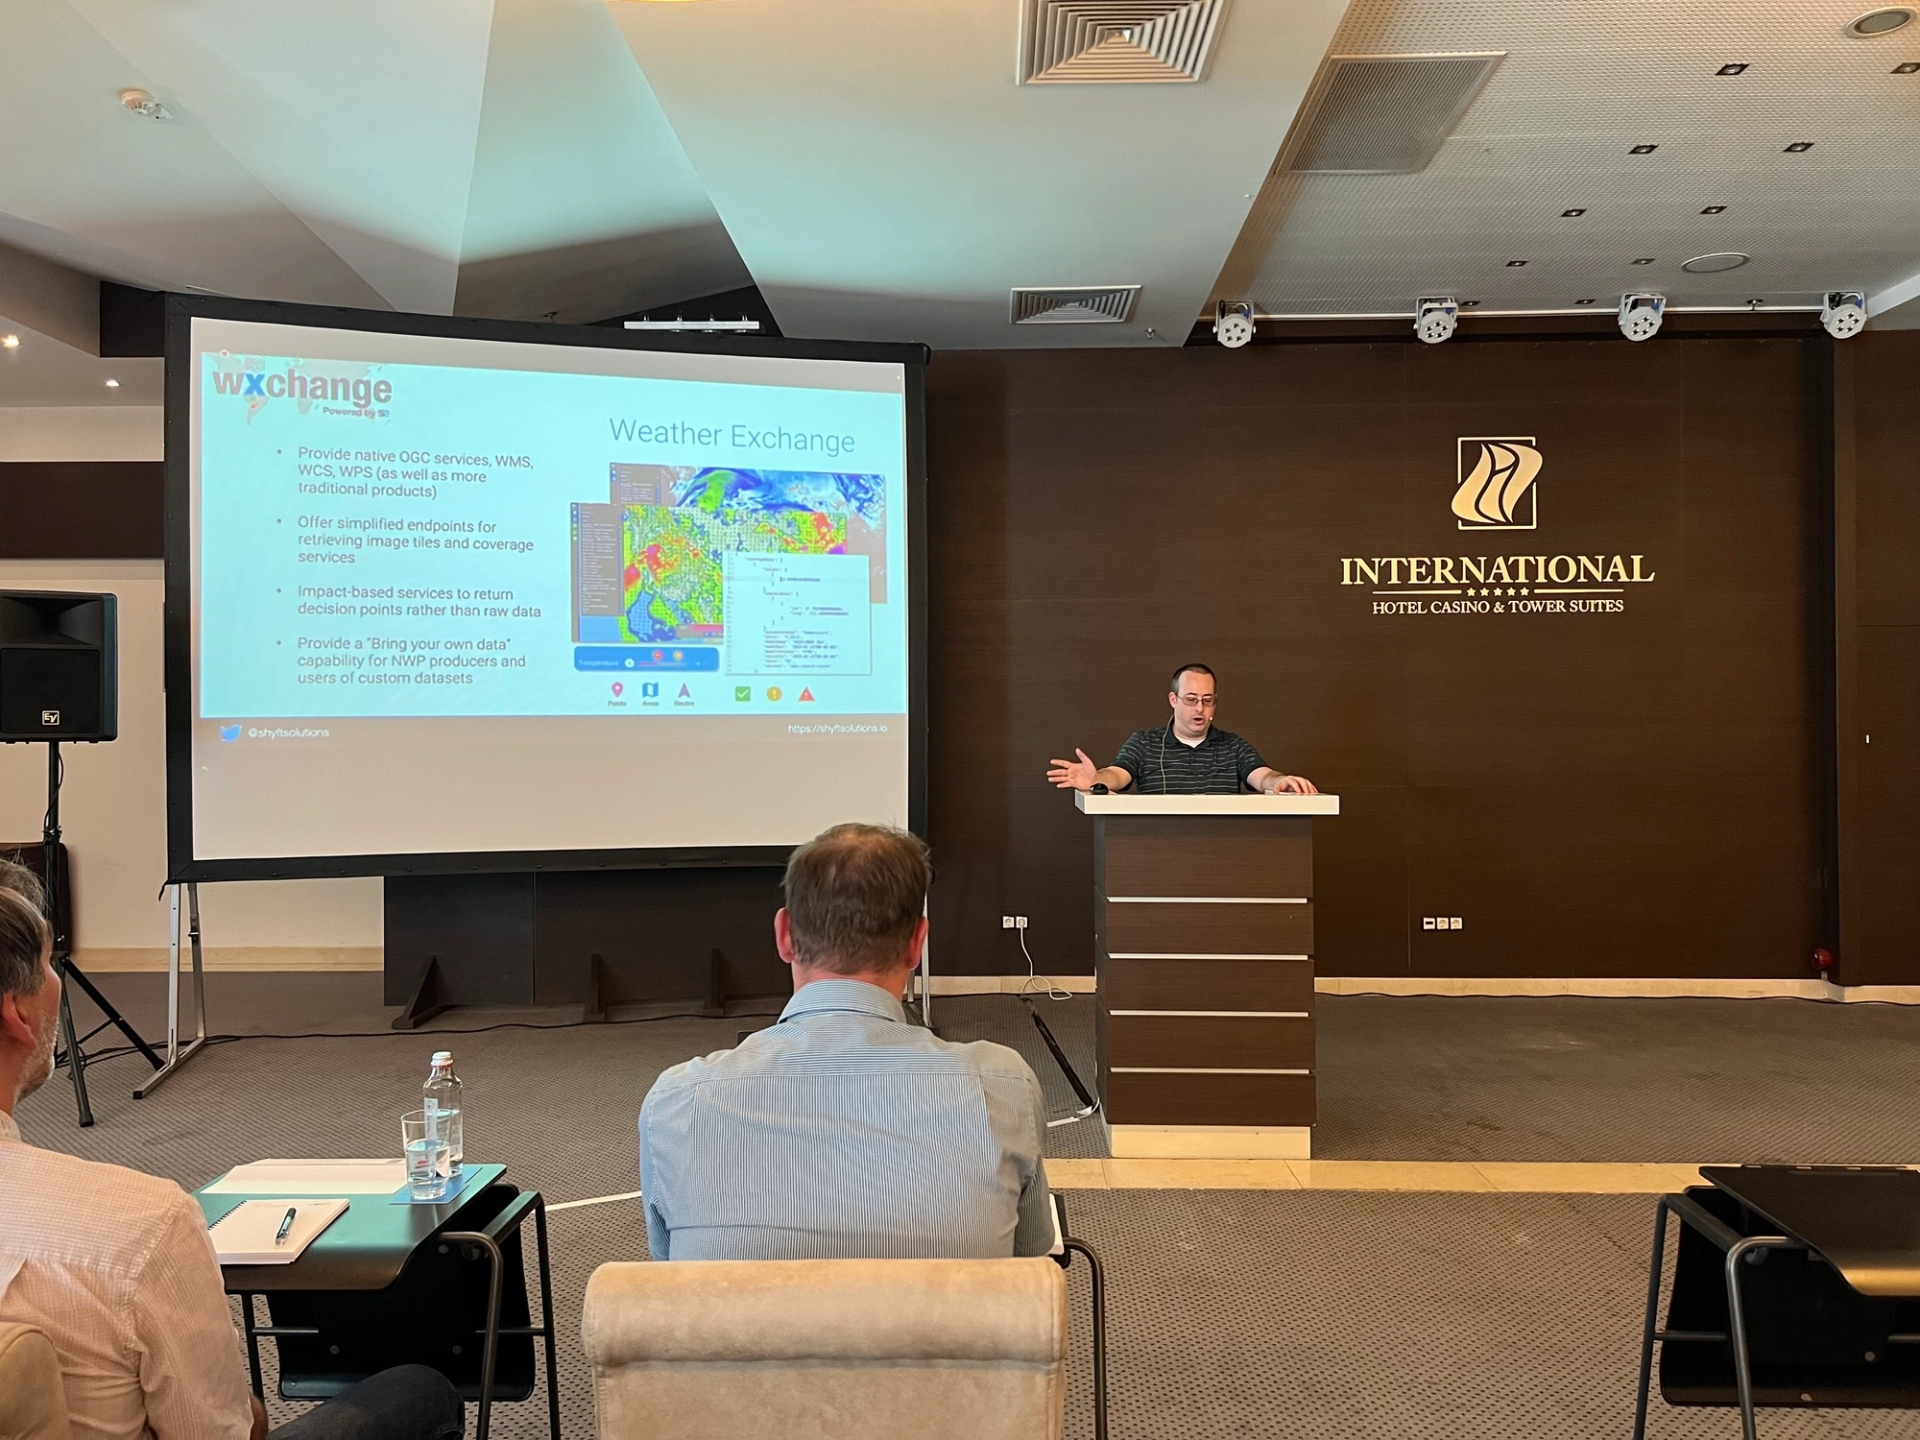
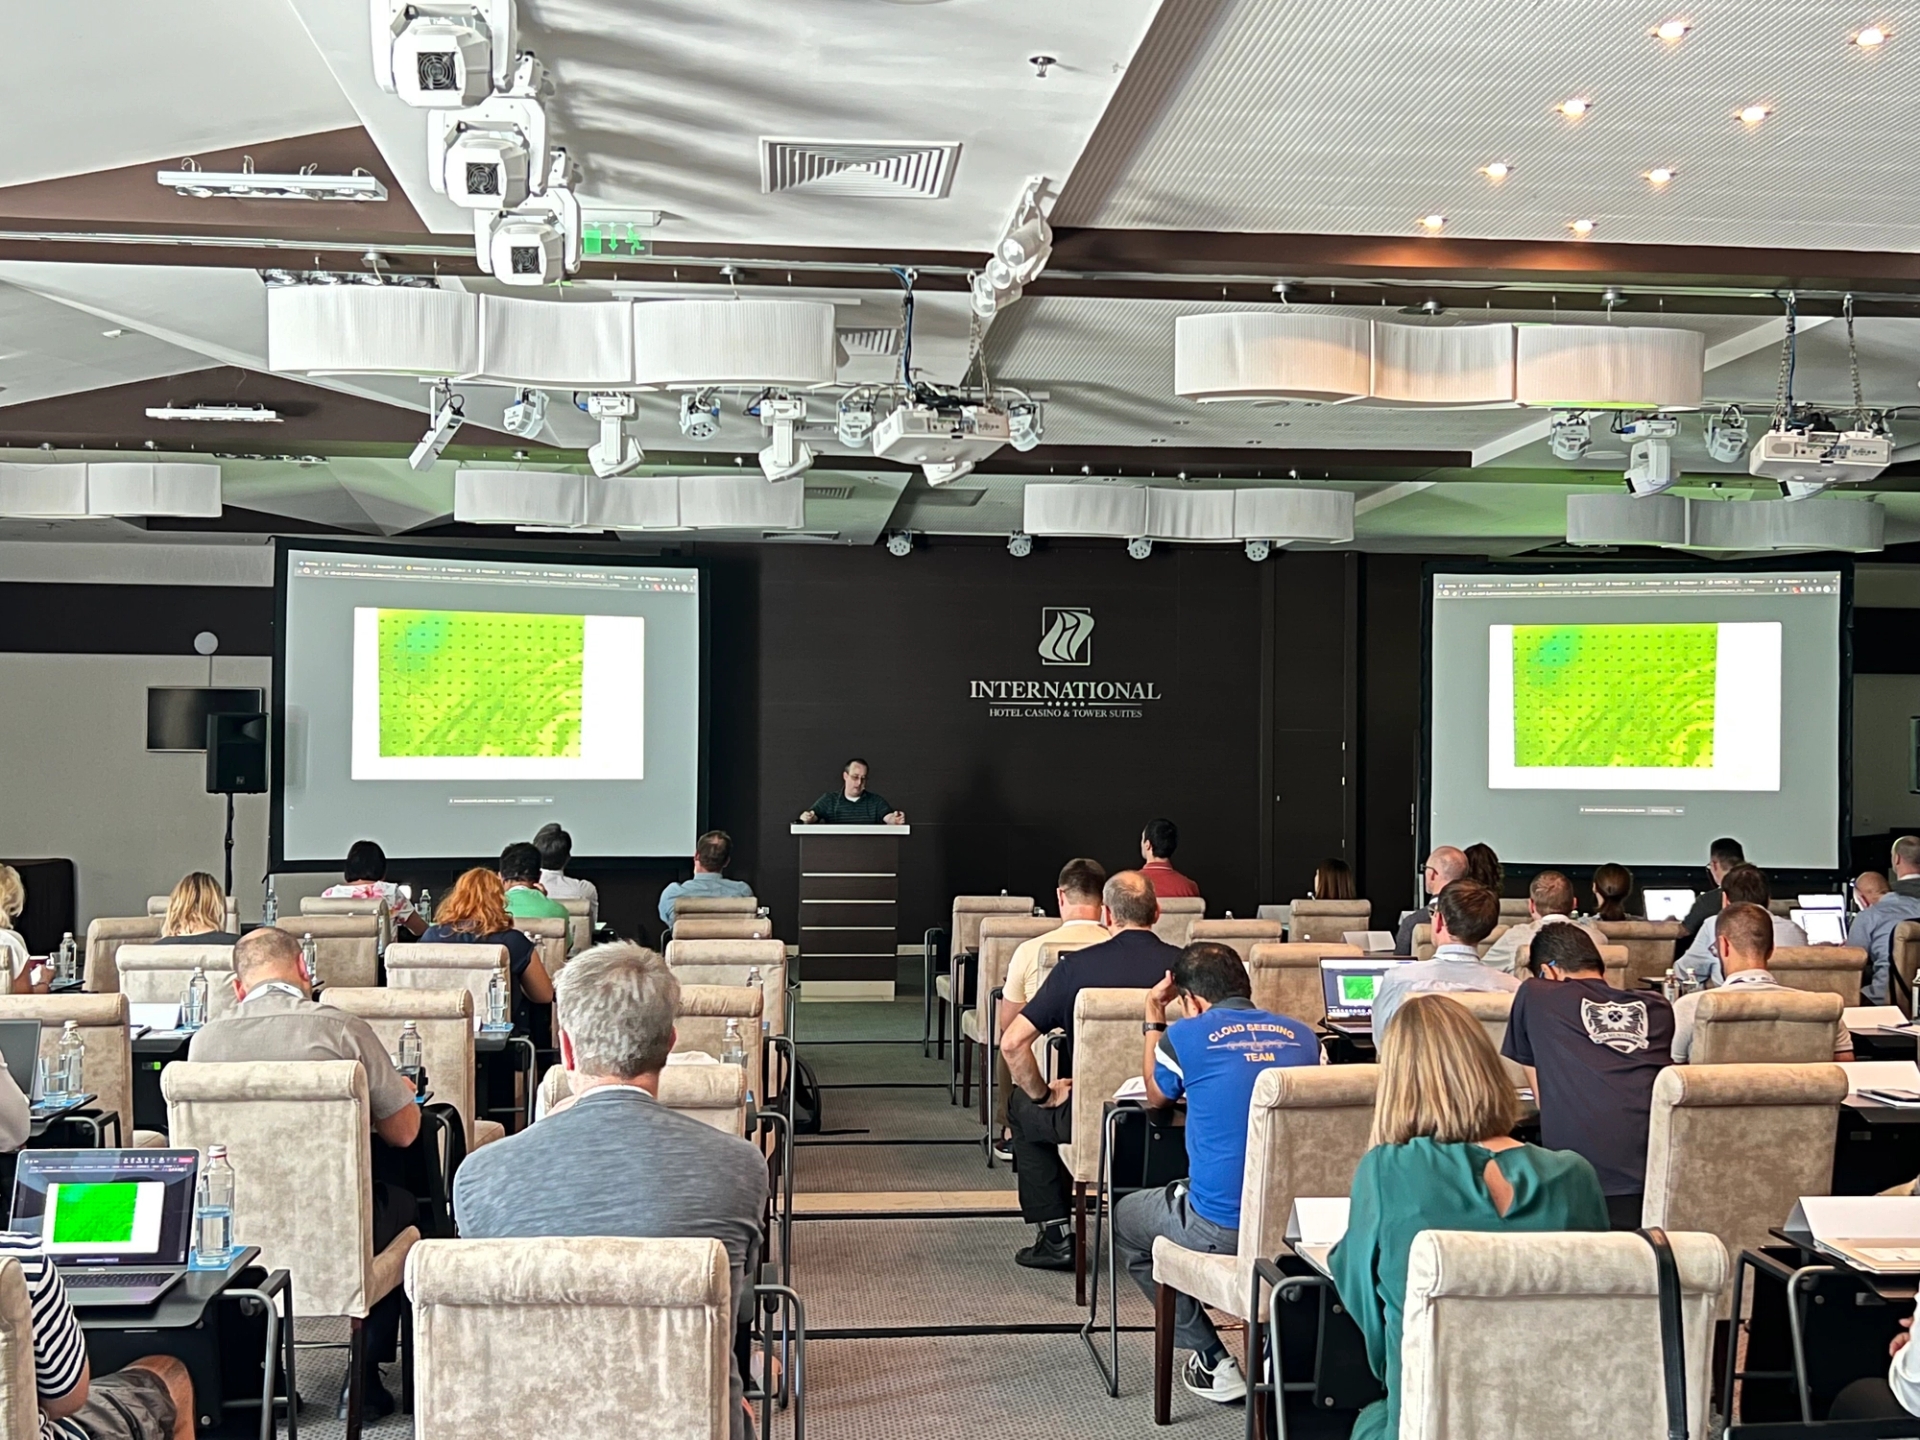
Since we haven't shared much about our commercial products in public yet, we thought it was high-time we did that. So while we were there, our CTO, Justin Worrell, did a User Presentation on the newest commercial capability in our Weather Exchange (WxChange) called Bring Your Own Data (BYOD). He started with an overview of how Bring Your Own Data works and then did a live demo (which actually went off without a hitch!). Below you'll find the slides from his presentation along with a description of how the process works.
WxChange
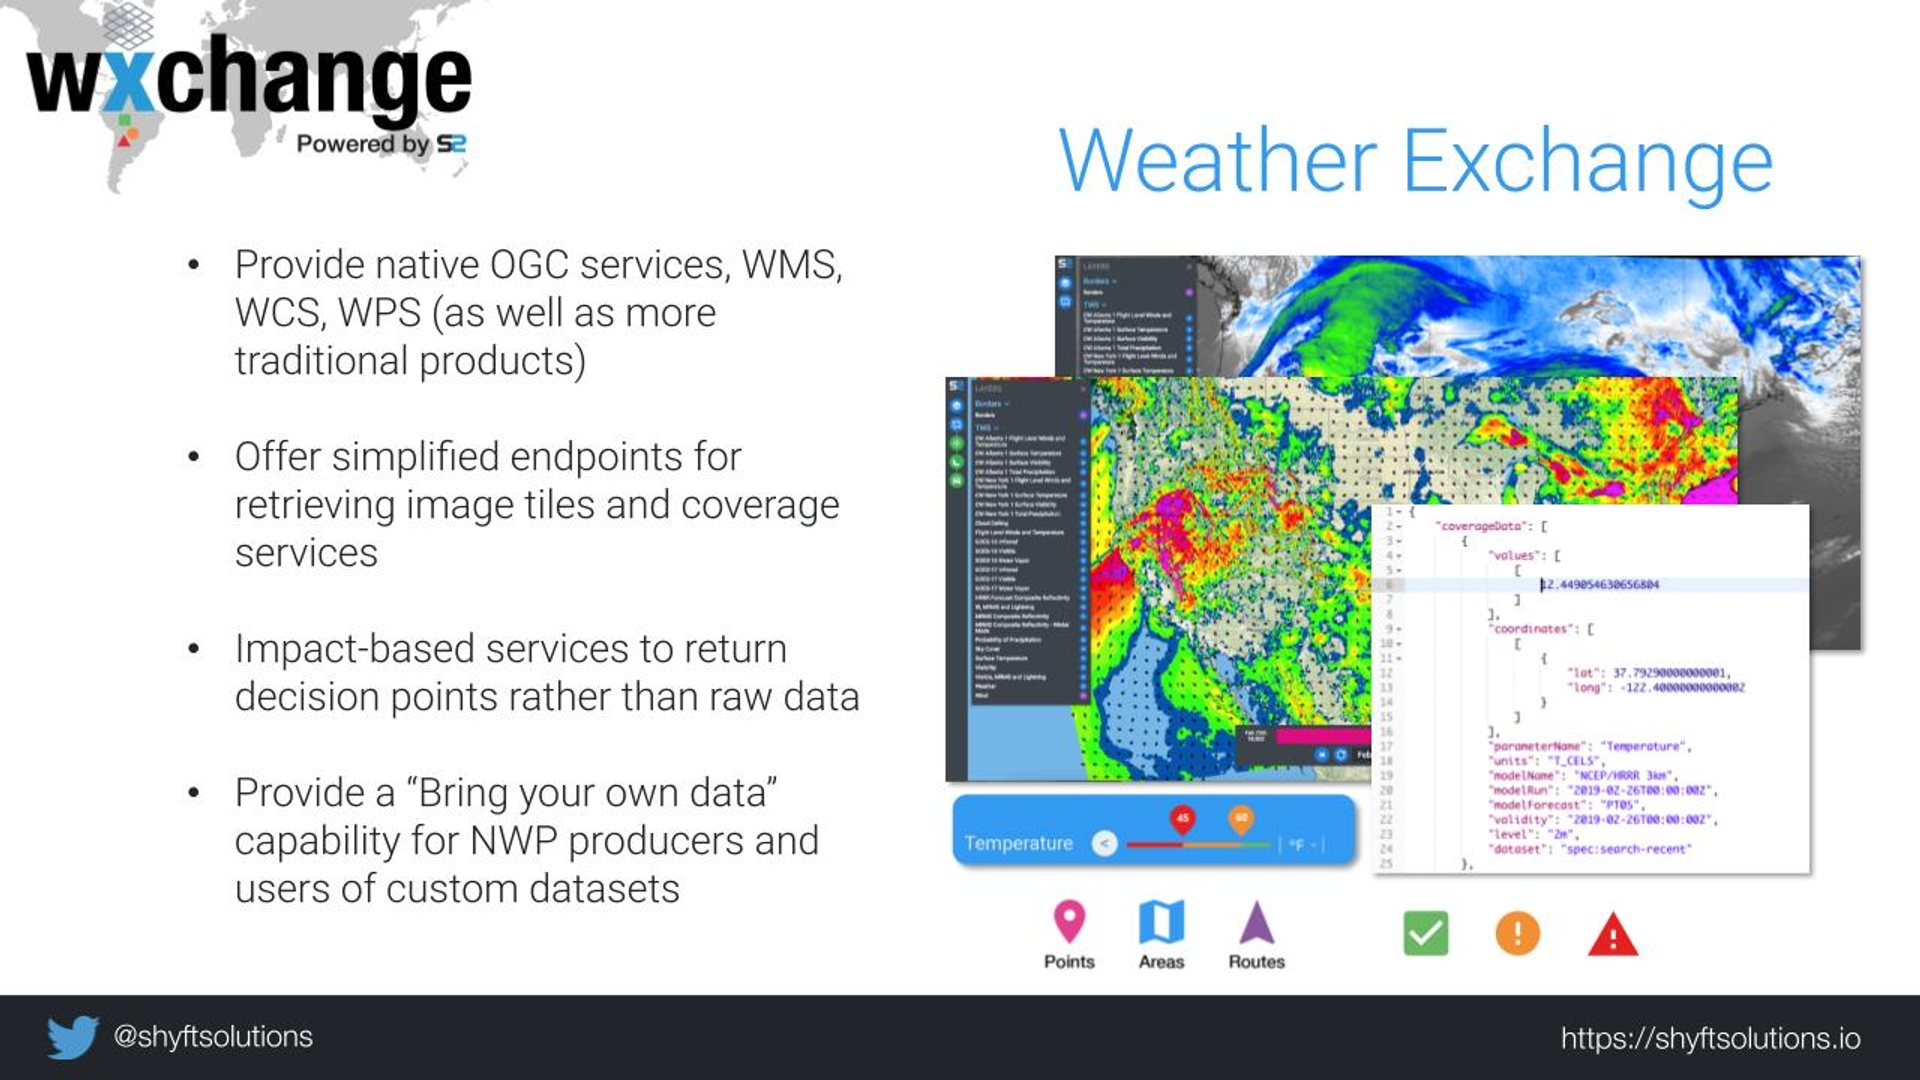
At a high-level, the WxChange is a platform that aims to connect three different audiences: producers of weather data, application developers, and weather data consumers. WxChange provides endpoints for accessing weather data in developer-friendly formats for use within existing business planning applications or for use within the WxChange viewers.
Over the past decade, we've worked with quite a few small businesses that produce weather data and then look for a company to build them a web viewer so customers can interact with that data. After doing this a few times, we determined that there's a market to provide an easy way for weather data producers to expose their data easily, so BYOD was born.
Bring Your Own Data
In our experience, weather data producers are typically scientists that are fantastic at creating highly accurate weather models. However, they usually do not have much experience exposing their data in a way that individuals and businesses can easily use it to retrieve only the data they need to make decisions. The WxChange abstracts that burden from the Data Producers with a feature called Bring Your Own Data. They no longer need to concern themselves with things like user authentication, creating data APIs, or a web viewer. They simply upload their data to the platform and we help make it avialable to users who would like to access it.
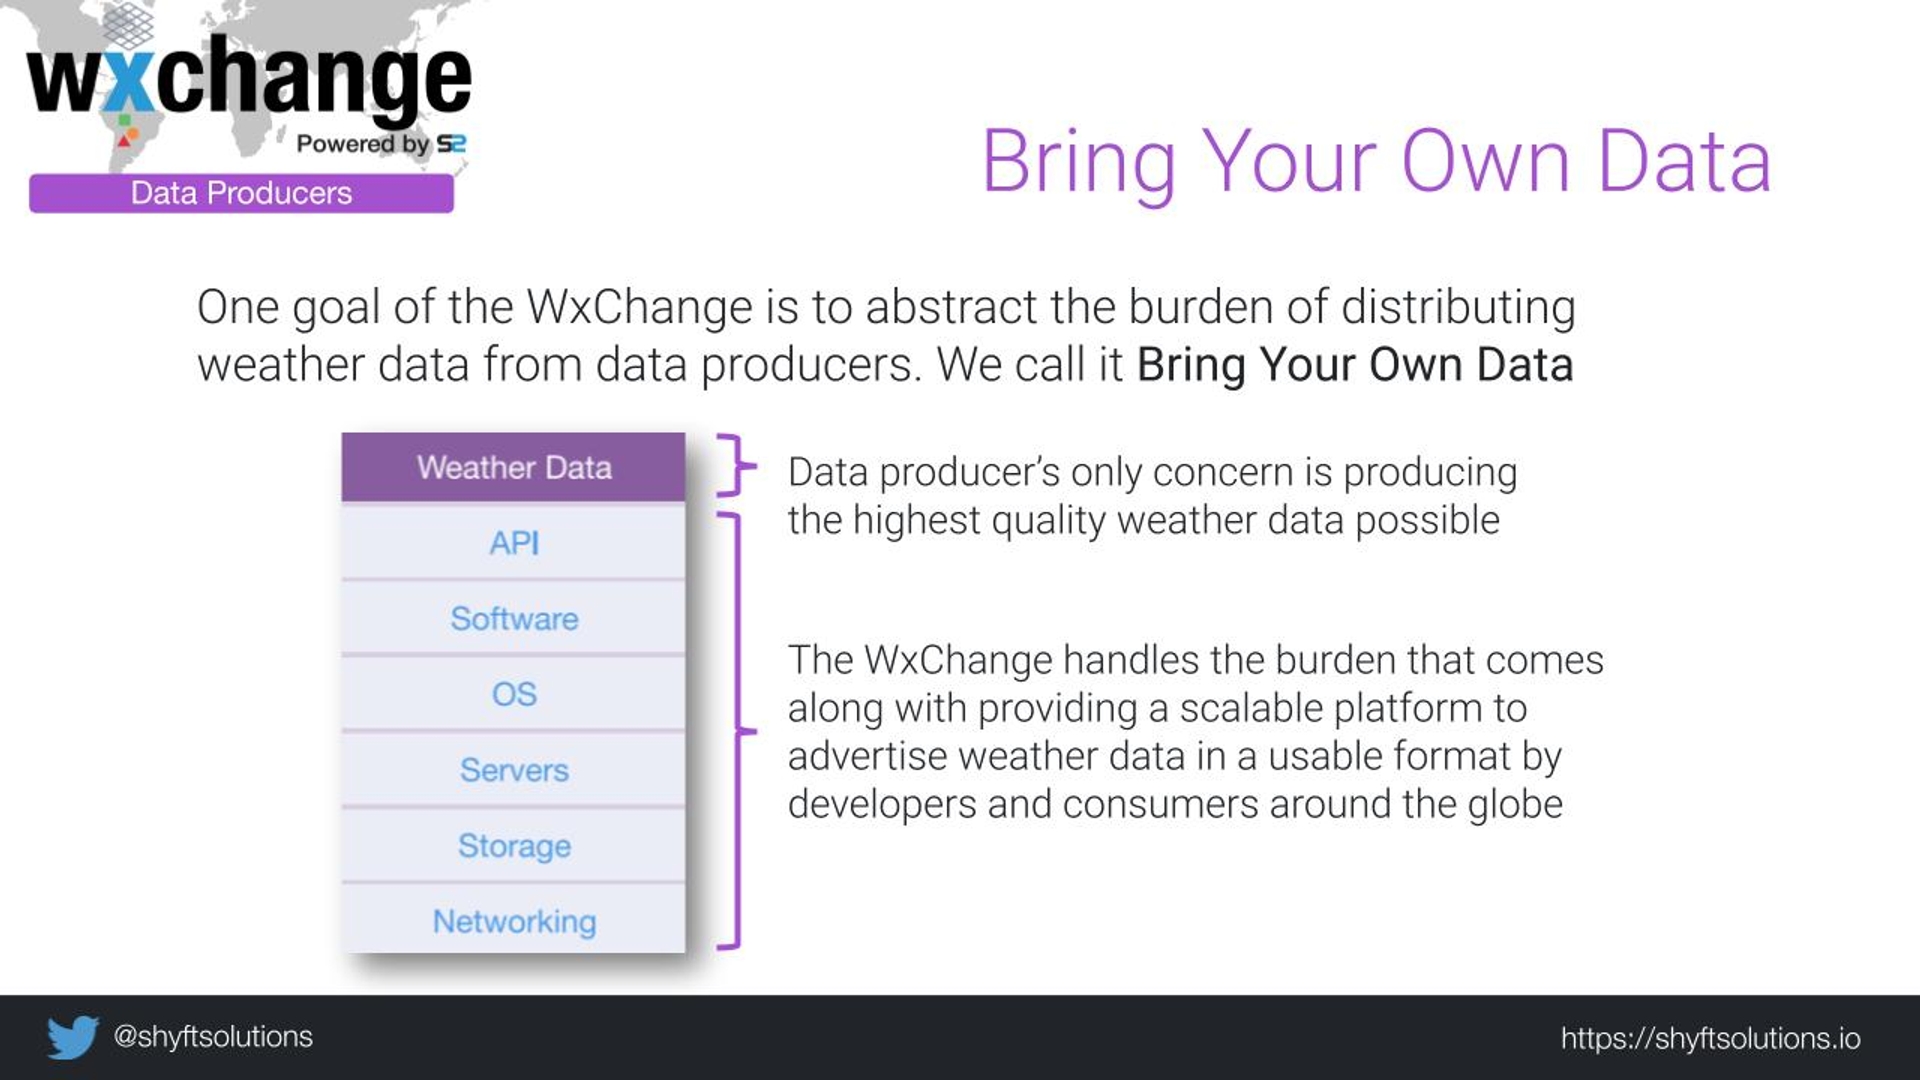
Step 1
We started by making this service available for use with Gridded Binary (GRIB2) files, one of the most common formats of weather model data. Producers of this data may run a model every 6 hours or they may run on-demand, high-resolution windows as their customers move to different locations to perform different activities. Nevertheless, in order to automate the generation of products, BYOD needs to know a bit of information about the model data and how they anticipate their users wanting to access that data.
So, the first API that a data producer interacts with is one to configure their dataset in the WxChange. While this is currently a machine-to-machine process, we envision users doing this through our WxChange business portal GUI eventually.
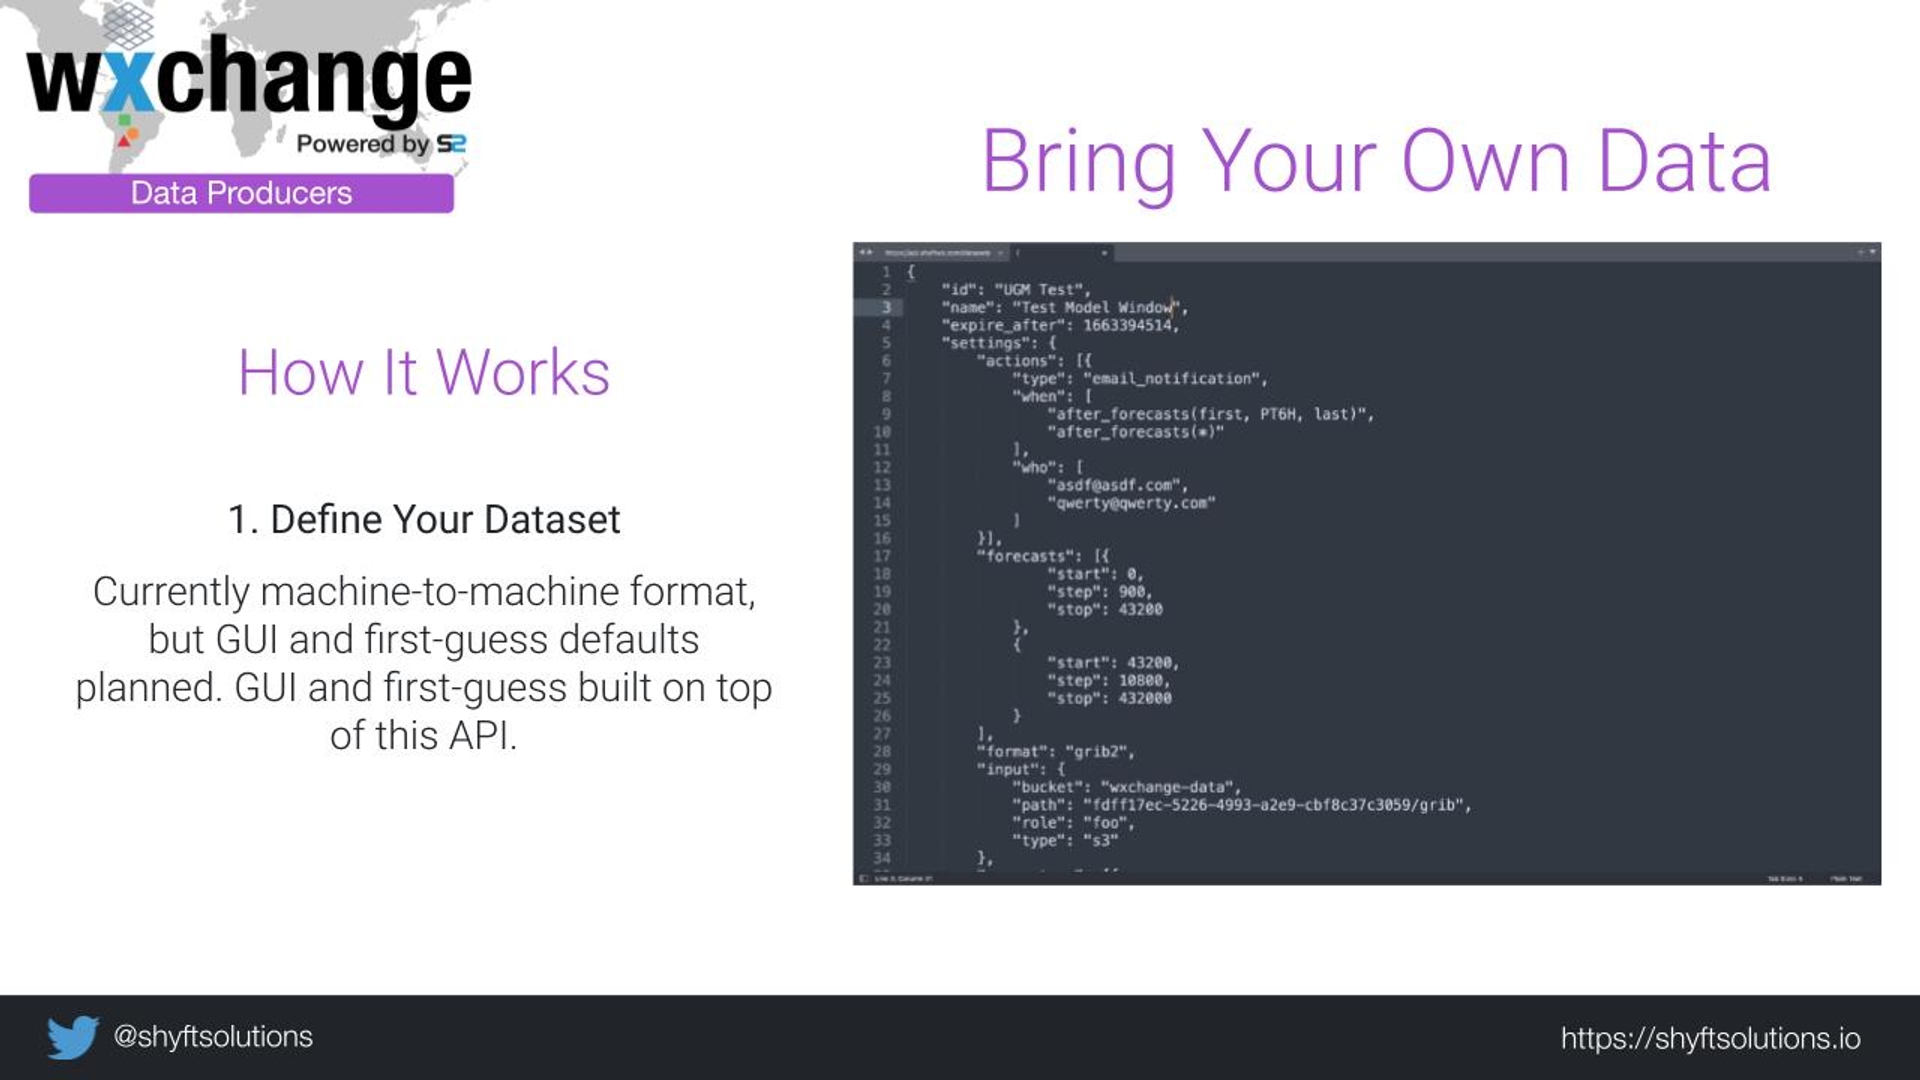
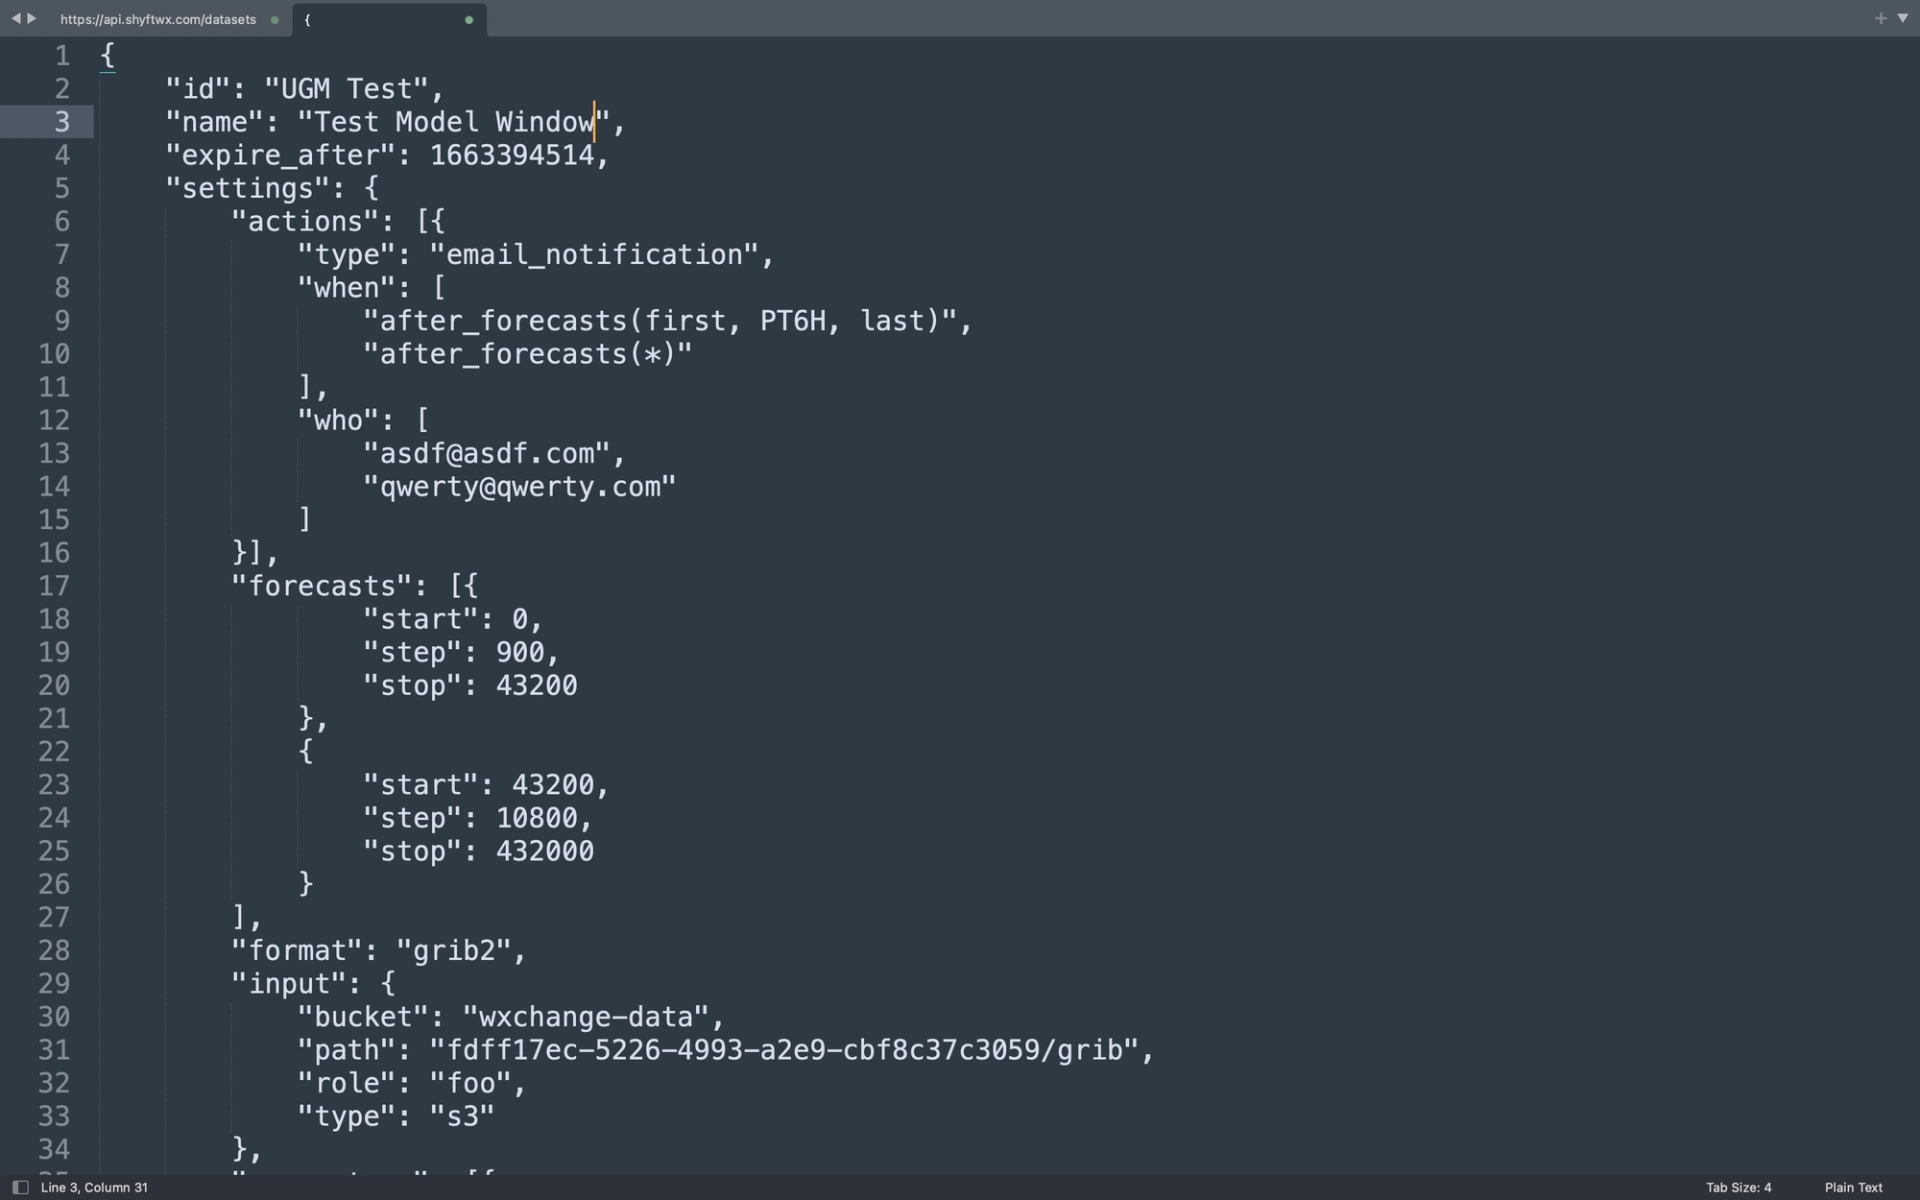
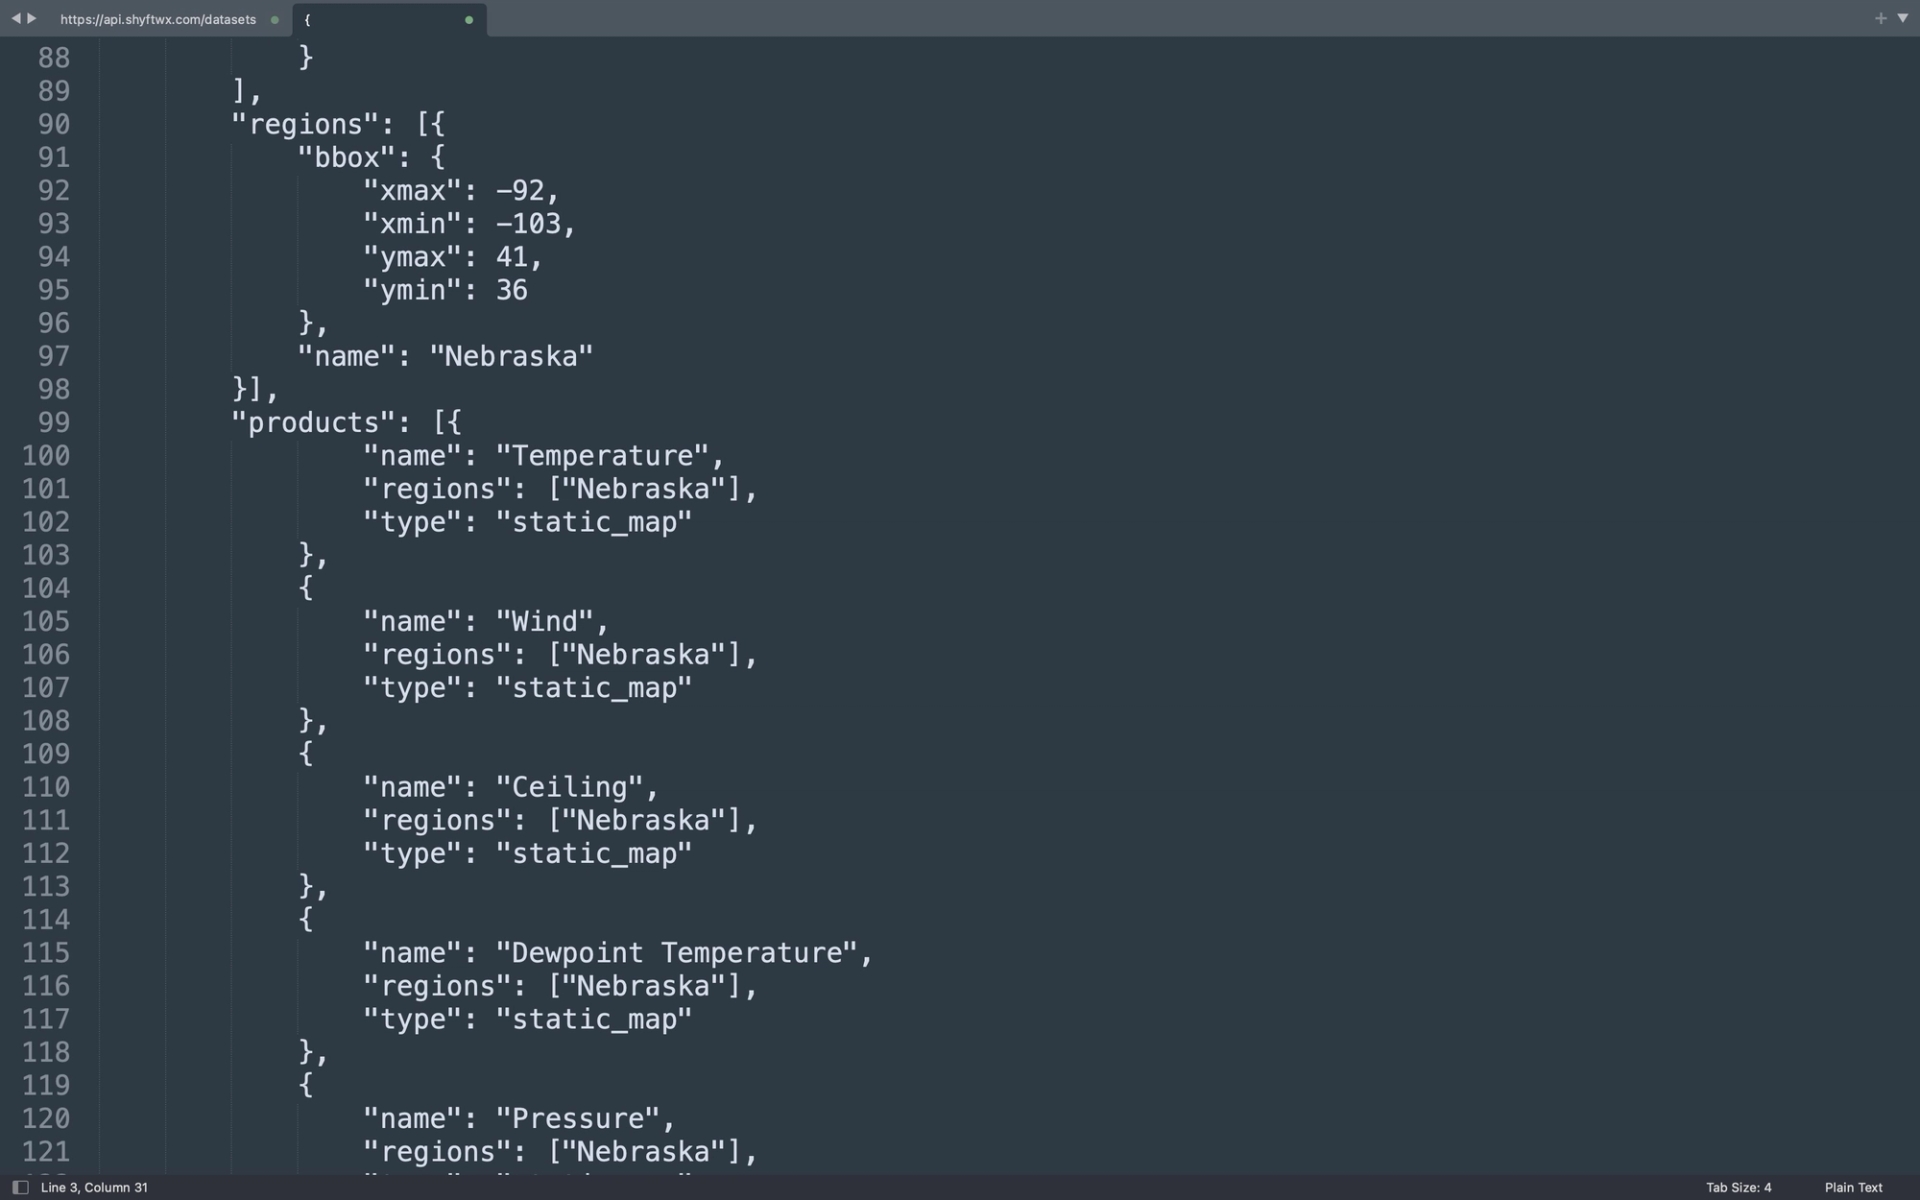
Below is a zoomed in version of the image on that slide showing how a data producer defines their dataset via a POST request to the WxChange "dataset" API endpoint. Many fields for this service are configurable, and some if left blank have defaults. Users can define how long each dataset will last in the WxChange (billing purposes), how many forecast hours they want exposed/visualized, where they plan to upload their data, which regions they want to provide their customers, and how to expose each weather parameter (static_map, wms, wcs).
The "dataset" API enpoint then returns the location of a few things: an input status endpoint, an output status endpoint, and the location of their personalized static viewer. Eventually, we envision this being a push notification mechanism, but at currently data producers can check the status of a specific dataset
Step 2
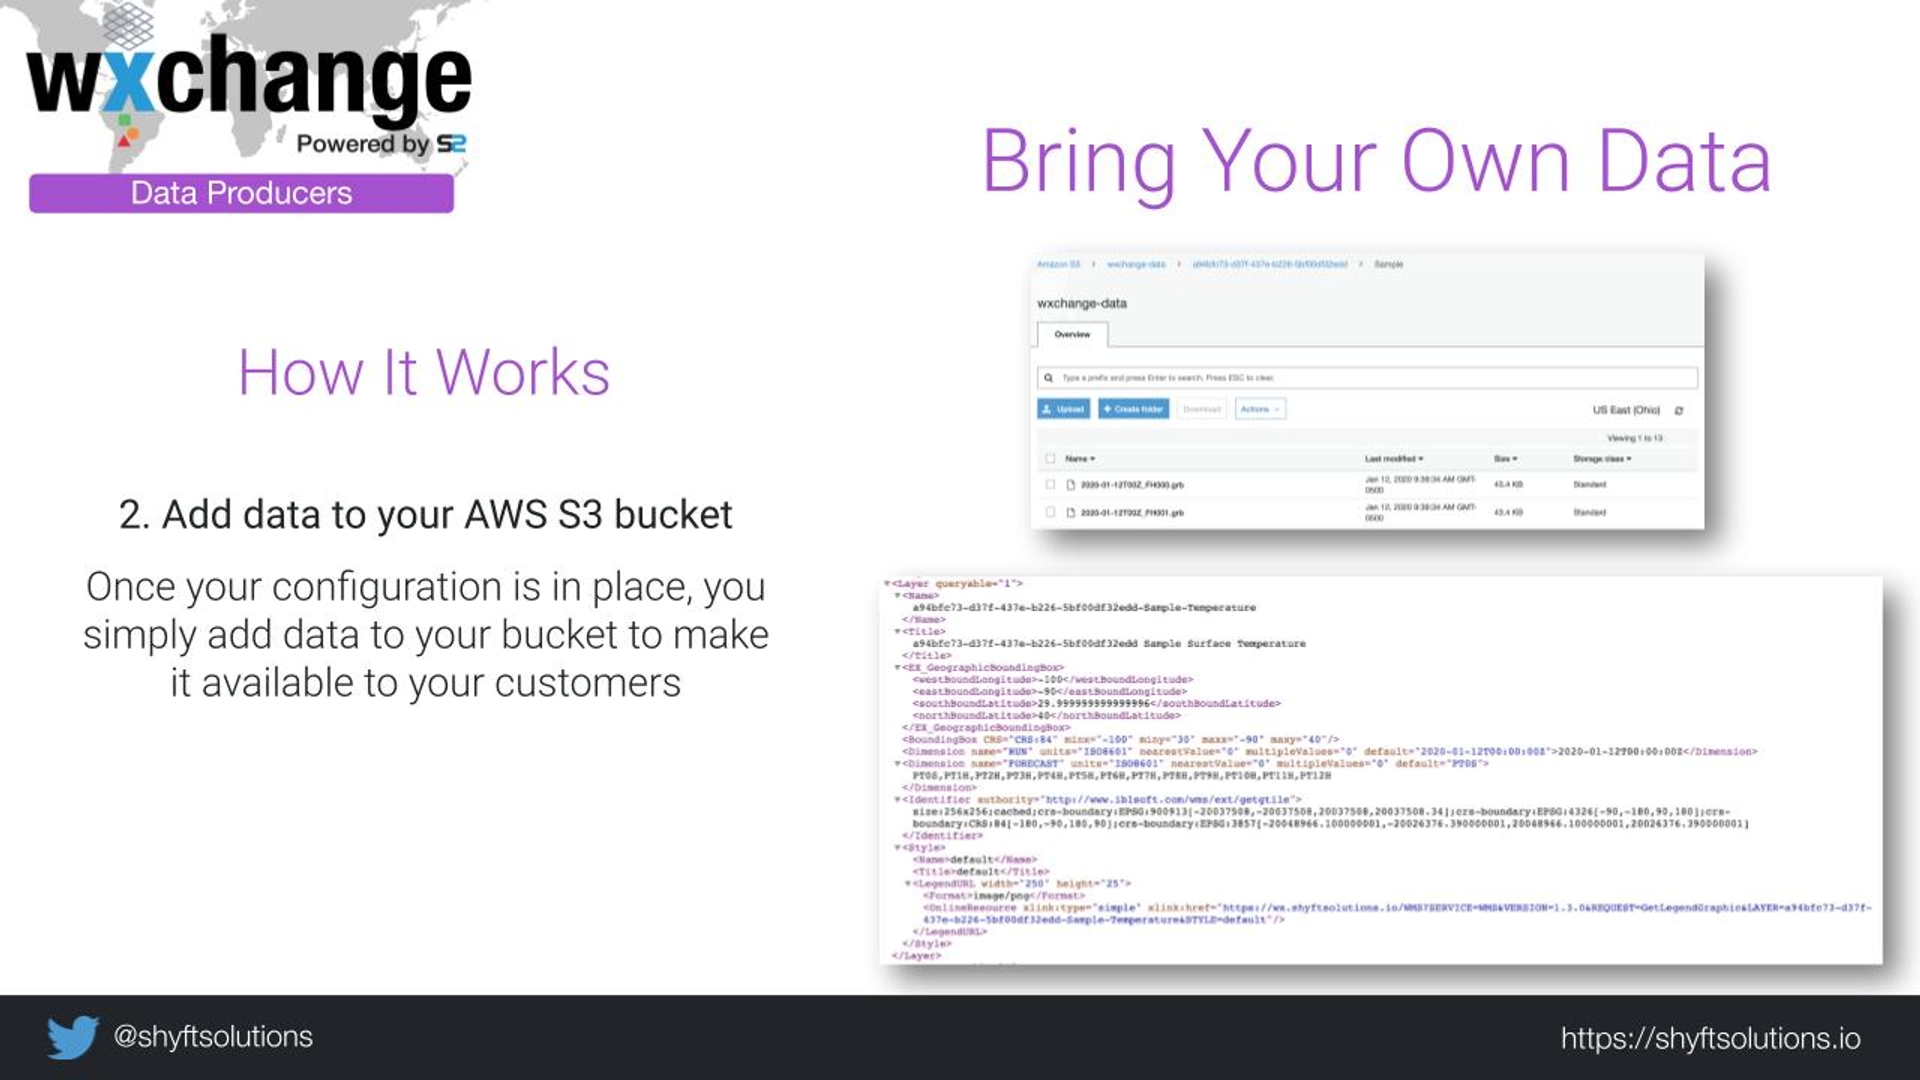
Once a dataset is defined in the WxChange, the data producer can simply upload GRIB2 files to their AWS S3 bucket that they defined in their configuration. Data arrival triggers a few actions on the backend. Since this capability was initially built to support a specific client looking to expose their data to customers via static maps, we ingest the GRIB2 data using one of IBL's products, Visual Weather and start generating map PNGs for the definied parameters at many levels through all forecast steps of the model run.
Step 3
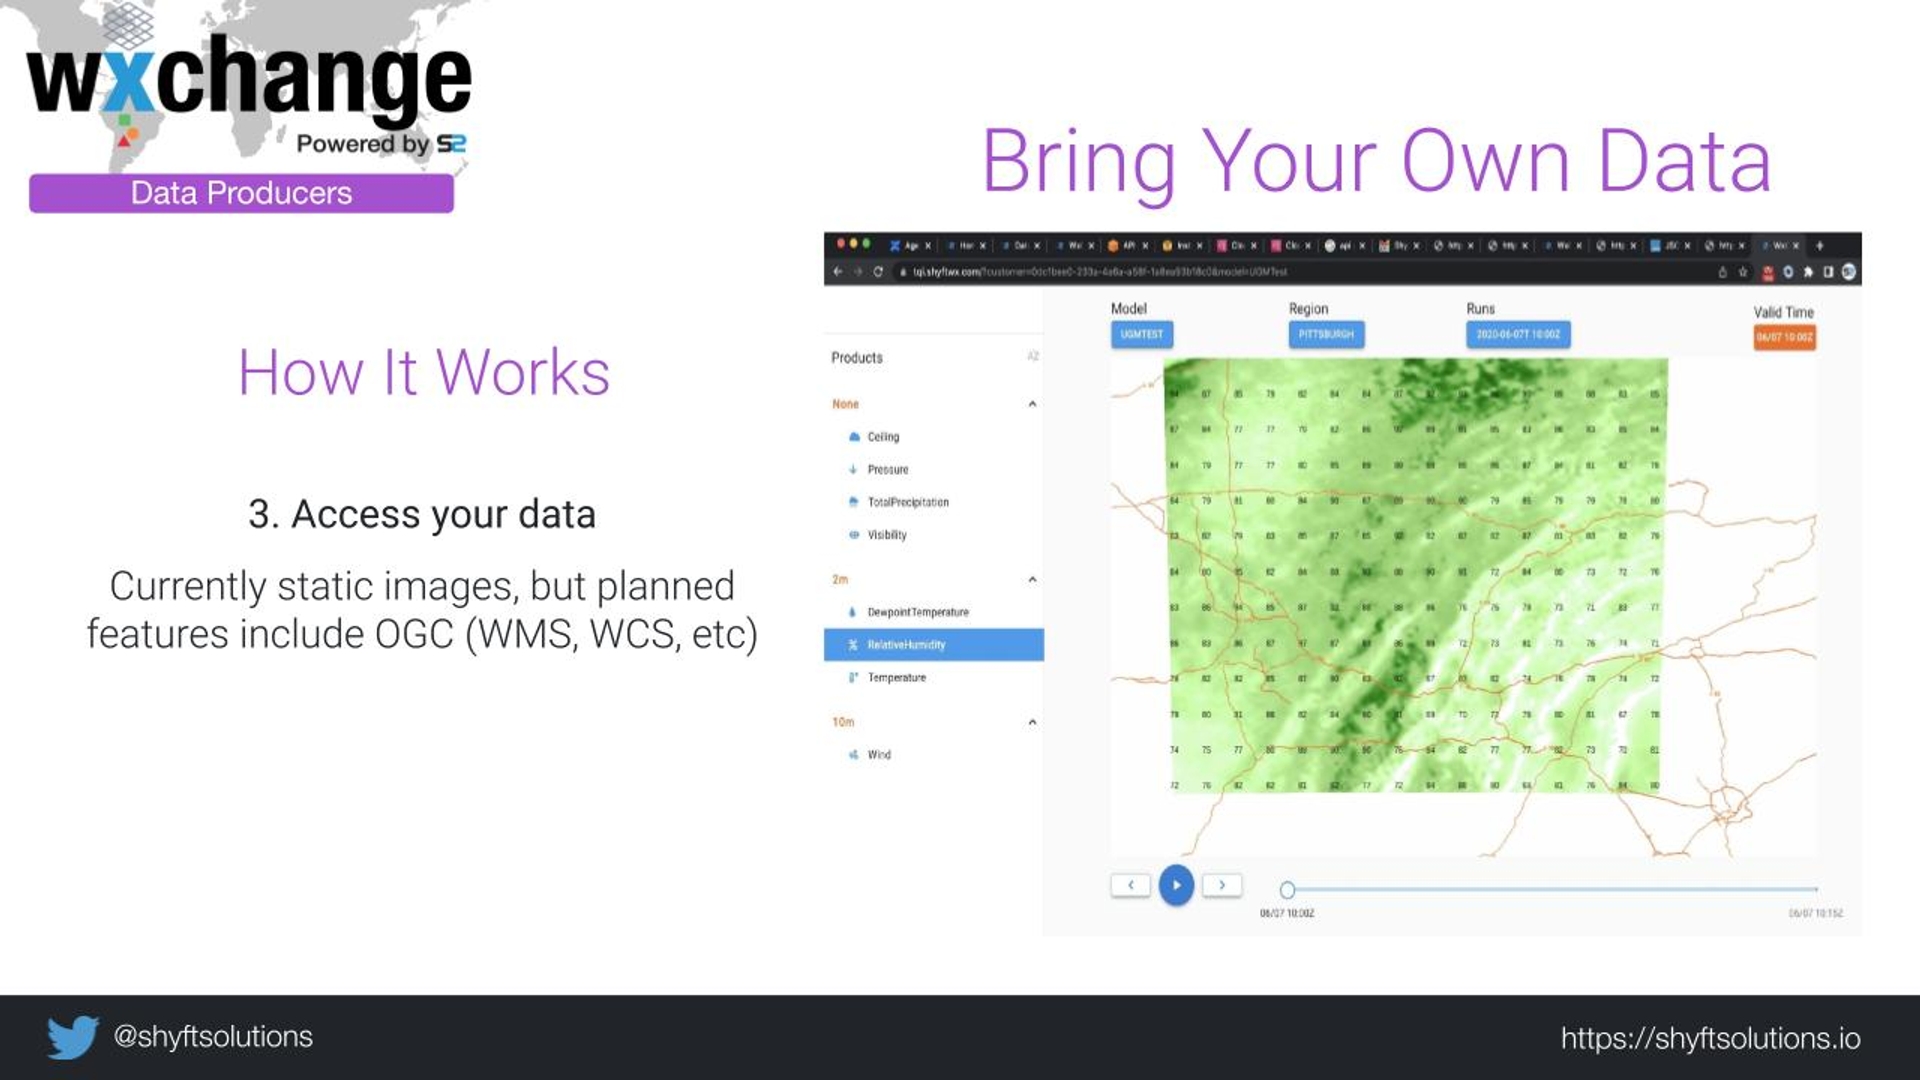
Once all of the files have been processed, users simply access their static map viewer at the link provided using their access key.
Cheers
Overall, the presentation went well and we had an excellent time in Varna. Cheers to another successful IBL UGM!

